Coffee Brewing: Extraction Yield & Strength
Two brews can share the same extraction yield and strength — yet taste entirely different. Why? As discussed in Interpreting Roast Color, roasting development influences solubility. The degree of solubility determines how much material can be dissolved into the brew - lipids, acids, caffeine, and melanoidins that shape sensory perception. Extraction yield is not a quality score. It is a measure of dissolved material relative to the dose of ground coffee.
Consider 30g of coffee and a 1:17 coffee to water brewing ratio. After accounting for retention the final beverage weight is near 450ml. Measuring the concentration of the beverage provides enough information to determine the extraction yield. As an example, 1.30% beverage concentration is another way of saying 5.85g of coffee solids are dissolved in 444.15ml of water. This means 19.5% of the original 30g of coffee was extracted.
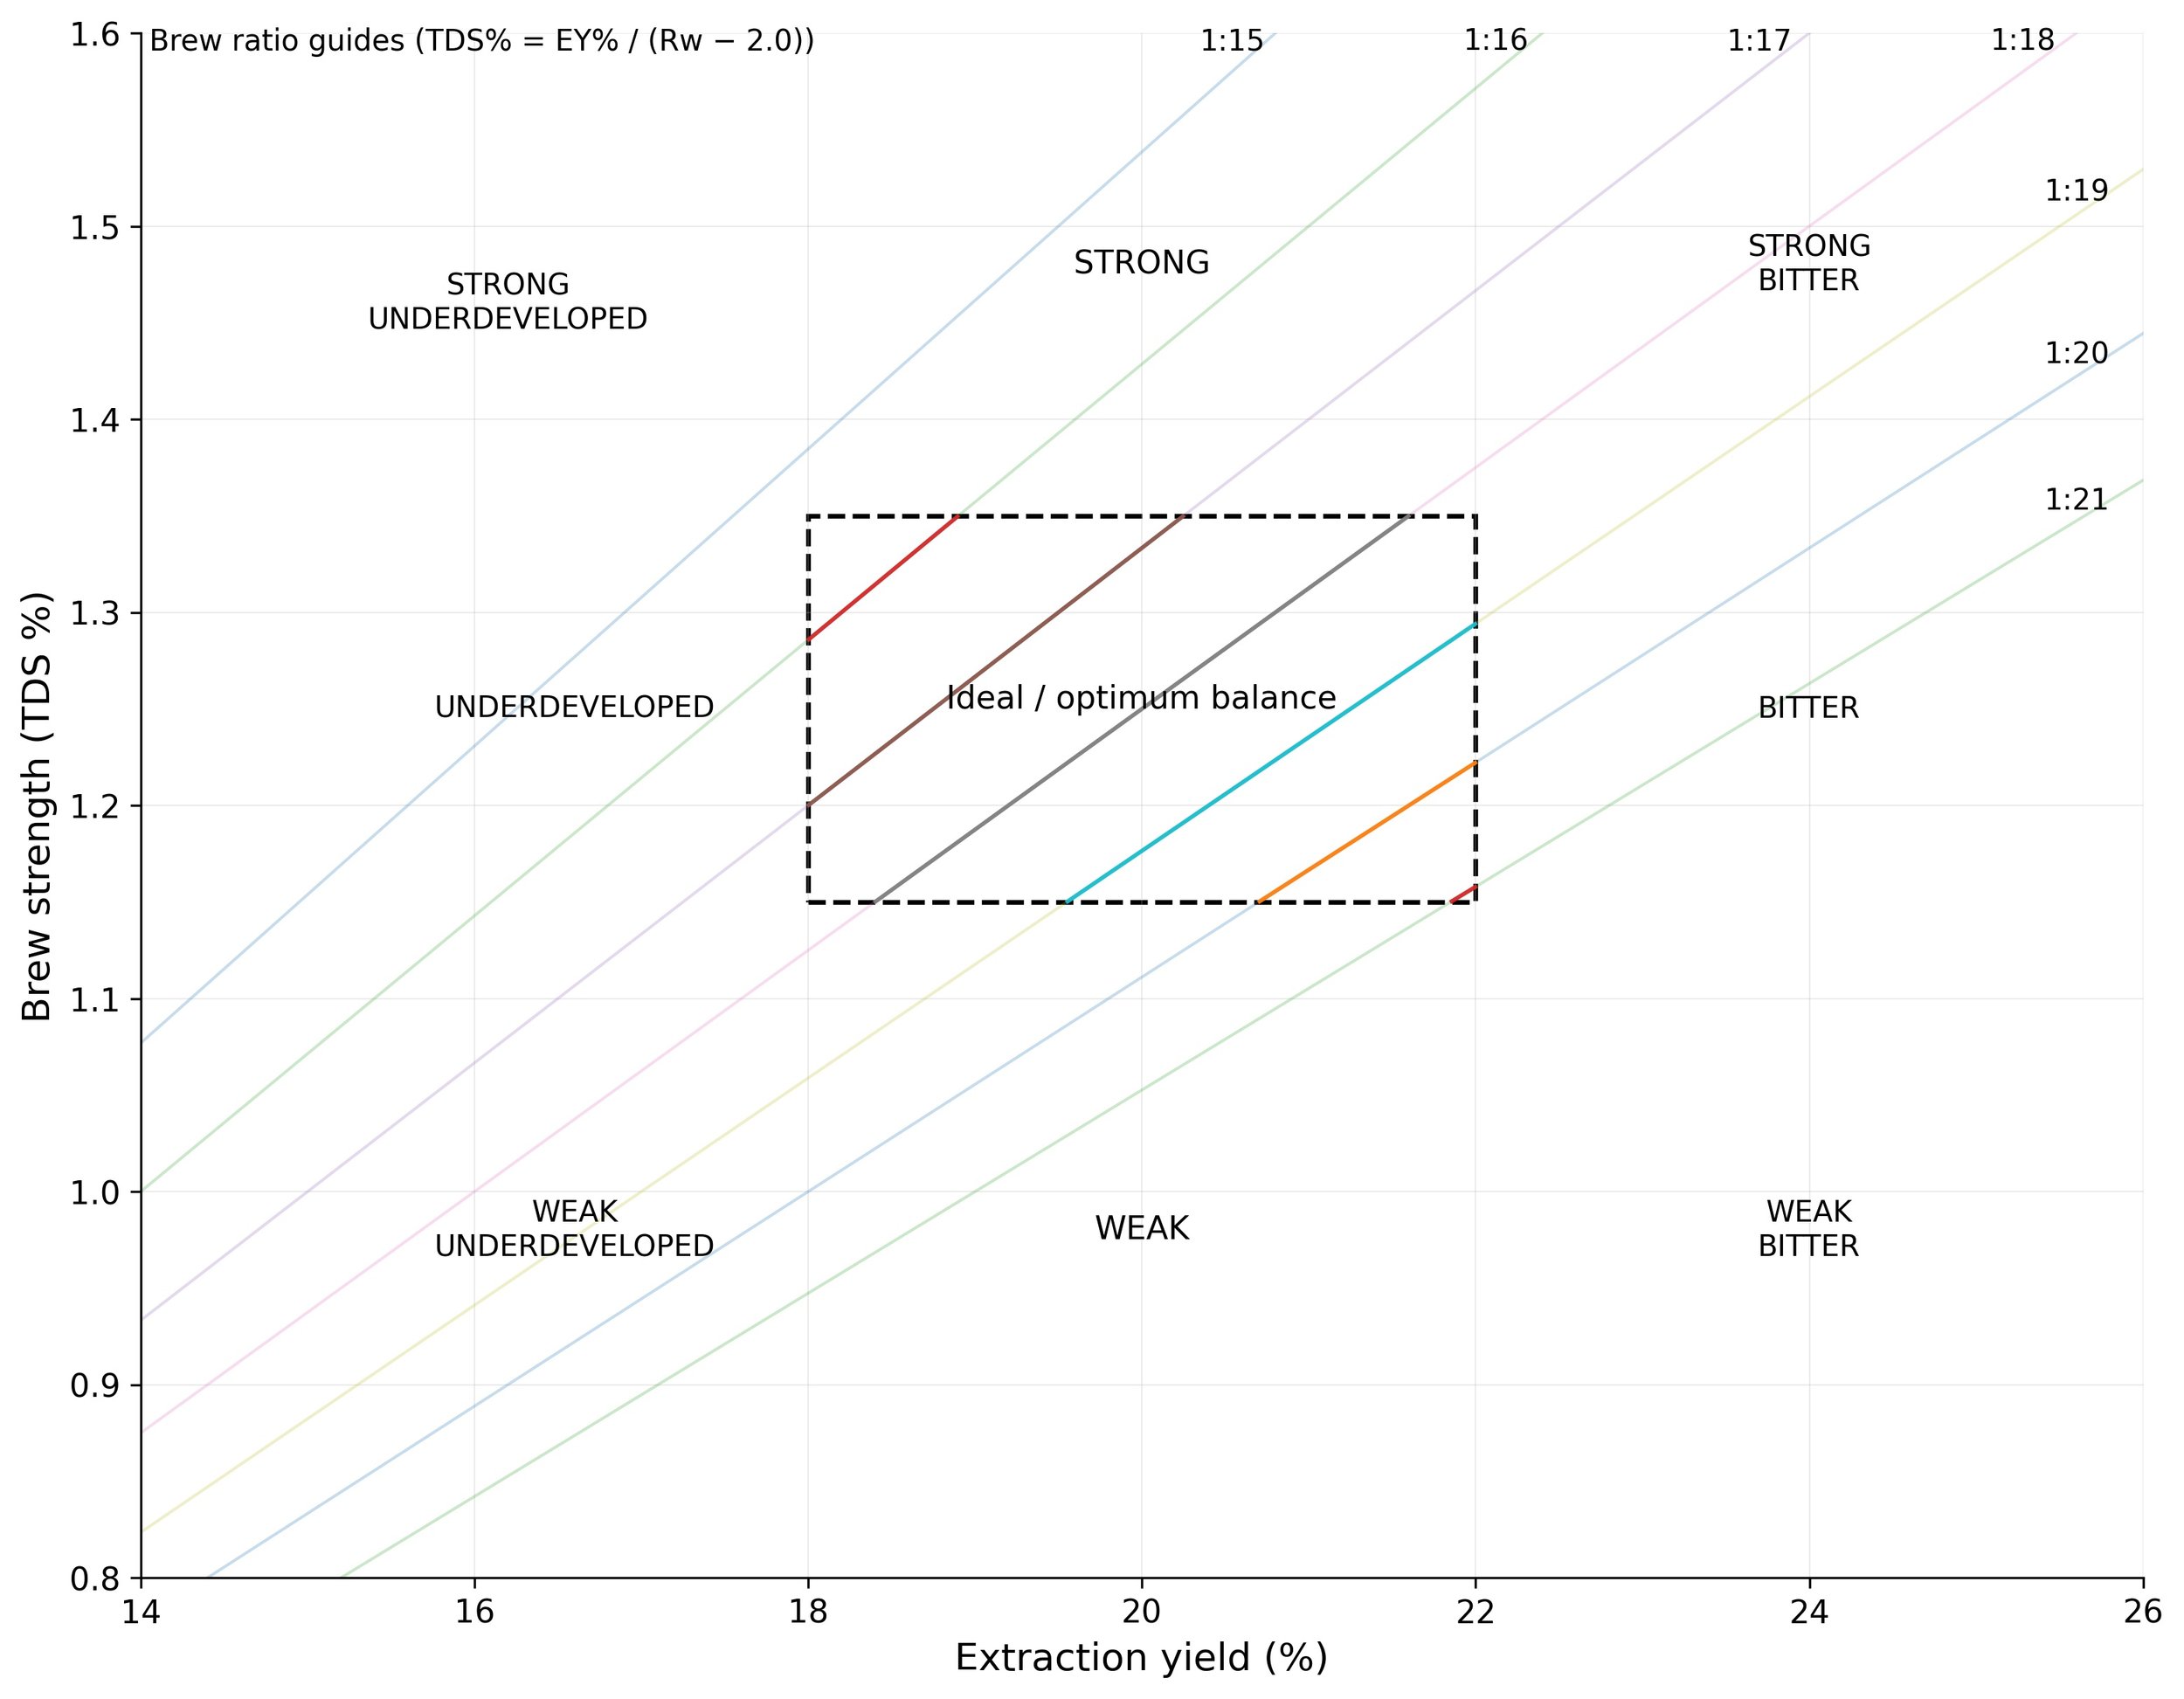
This foundational concept is the work of Dr. Ernest Earl Lockhart who designed the first Brewing Control Chart (1957) aimed at identifying consumer preferences and ideal filter coffee recipes. This chart recommends an extraction yield between 18 – 22% and a brew strength between 1.15 – 1.35%. In the chart below this is referred to as Ideal/Optimum Balance. To achieve these results would require certain coffee:water ratios (1:16 – 1:20). However, it reflects assumptions about roast style and consumer preference from a different era. The model described what people liked, not what coffee is capable of.
Since 1957 the advancements of roasting and grinding technology have improved. It is now easier than ever to roast consistently and achieve greater particle uniformity. All of these conditions would point towards the possibility of yielding higher, more even extractions. However, it is difficult to note if this trend is taking place when measurement culture has not evolved at the same pace.
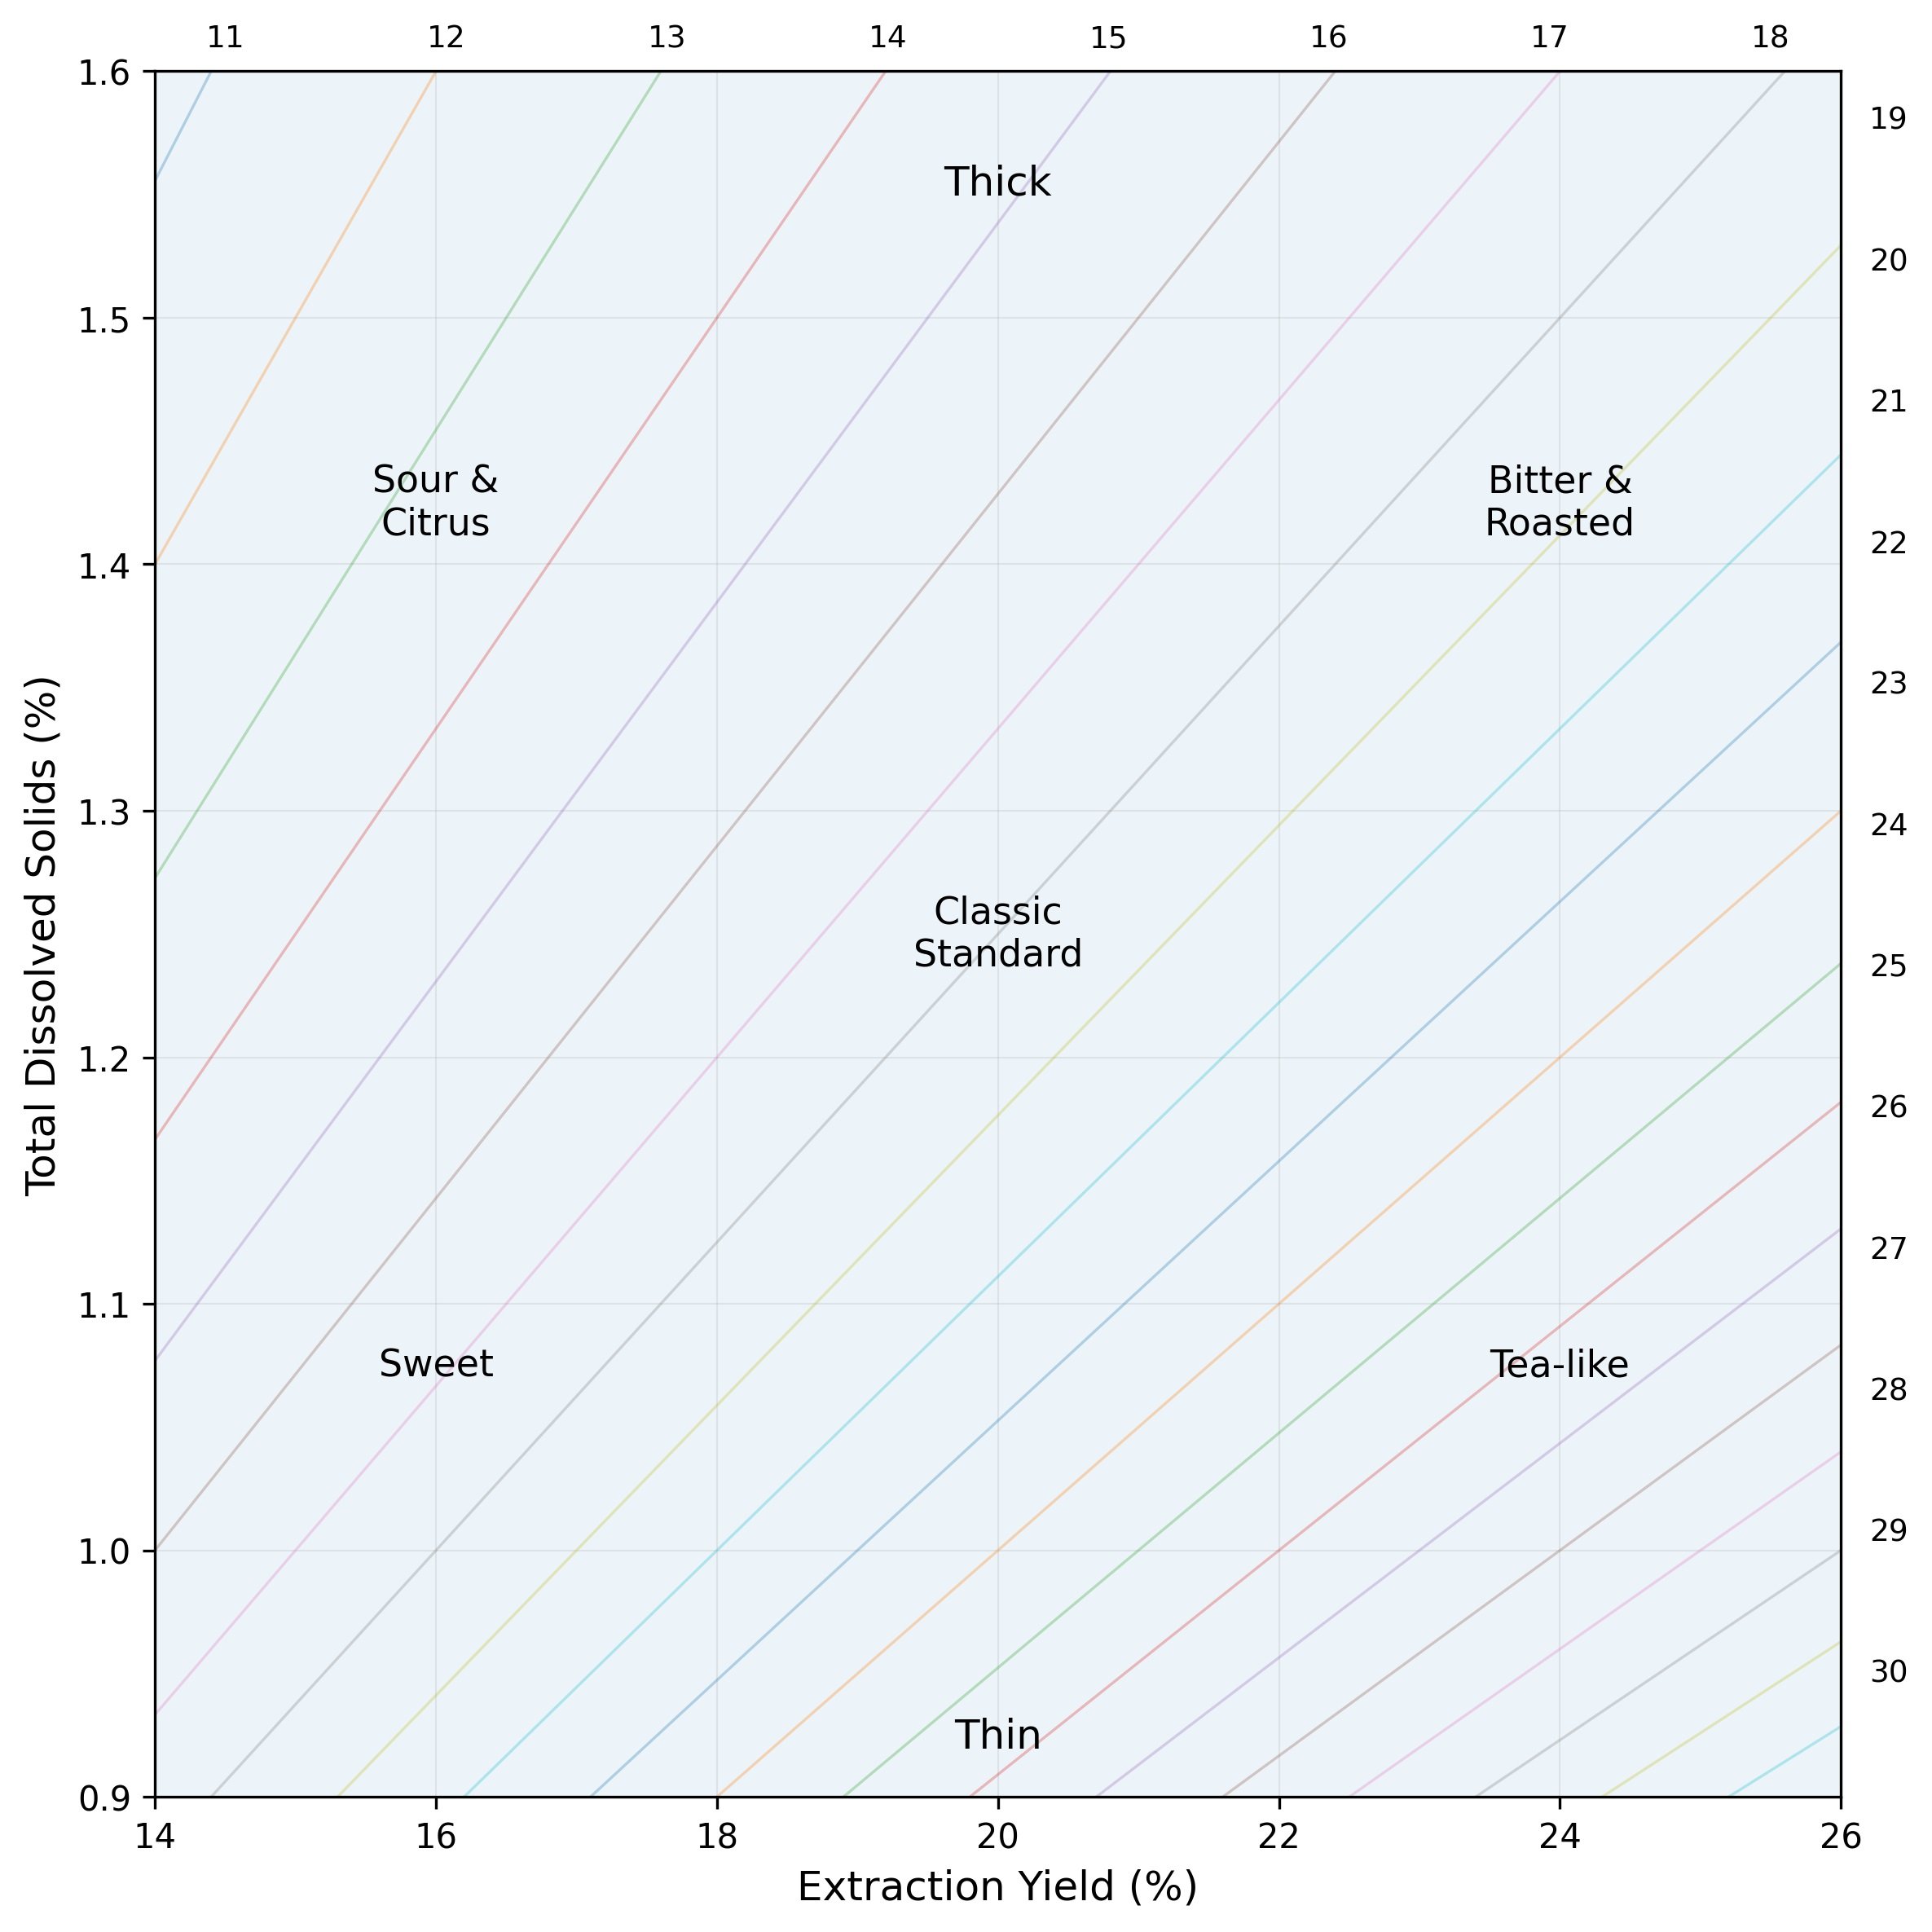
In 2023 the Specialty Coffee Association released an updated Brewing Control Chart based on research conducted at UC Davis. Unlike Lockhart’s original model, which defined a single “ideal” zone, the revised chart maps consumer preference across a wider range of extraction yields and brew strengths. The findings suggest that there is no universal sweet spot — rather, distinct clusters of preference exist. Some consumers favor higher strength and higher extraction brews with greater body and bitterness tolerance, while others prefer lower strength, sweeter, and more delicate cups.
However, even this updated model centers brewing variables — extraction yield and strength — without accounting for differences in roast development, soluble potential, or coffee chemistry. Two coffees brewed to the same 19.5% extraction and 1.30% strength may taste dramatically different depending on how well they were developed in the roaster, growing conditions at origin, and post-harvest fermentation practices. Take for instance a naturally processed coffee roasted to end temperature 240°C - an extraction at 17% would still have bitter & roasted attributes because those compounds were formed during roast development, not during brewing.
These studies remind professionals that every strength and extraction combination implies a specific ratio — whether we calculate it or not. Extraction yield and strength describe brewing outcomes — but they do not define flavor quality independently of roast development and soluble potential.