At this year's Alpine Roasting Championship, I served in two roles simultaneously: as a jury member scoring each roast on sensory criteria, and as the measurement lead responsible for capturing Agtron color values from every batch before it went to the table. Twelve competitors, one Giesen G15, five jury members, seven weighted sensory categories. The color data from that day tells a story worth examining carefully.
The Tool
Every batch was measured using the DiFluid Omix, which outputs a value on the Agtron scale — a numerical representation of roast color where higher numbers indicate lighter development. We take two readings per batch: whole bean (surface color) and ground (internal color). The difference between these two values is what I call the color gradient.
The gradient is not incidental. It is a structural property of the roast. During the early stages of development, the exterior of the bean is exposed to more heat than the interior, and the two surfaces diverge in color. After first crack, as the cell walls become more porous and heat penetrates more efficiently, the gap begins to close. How far it closes — and how quickly — depends on roast duration, charge temperature, and development time. A wider gradient means the exterior developed faster relative to the interior. A narrower gradient means the two converged.
In sensory terms: too wide a gradient produces sharp acidity and astringency. Too narrow produces a hollow, papery quality — or, at darker color levels, a pronounced roastiness that suppresses origin character. The range I have identified as the preferred zone, based on repeated measurement across different origins and roast styles, is 27–33 points.
Before the Competition: A Controlled Experiment
Before the jury scored a single competition batch, we conducted a calibration exercise. One Colombian washed coffee was roasted to three different profiles, and the jury cupped blind with no knowledge of the color data. The results:
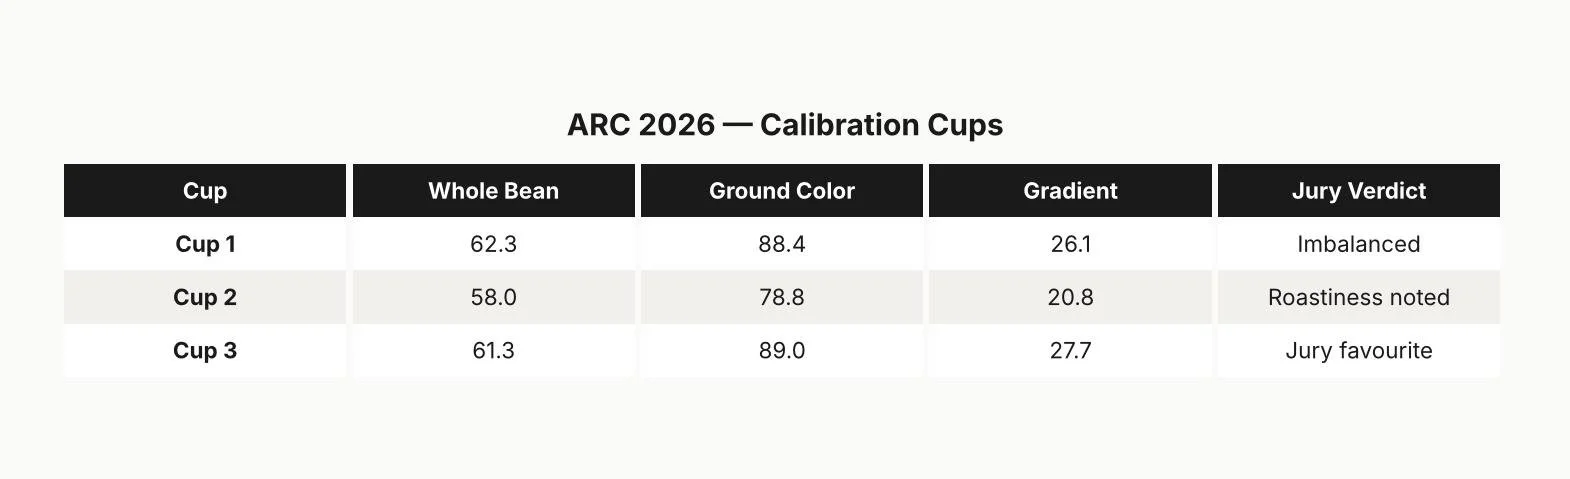
Cup 3 was preferred. It sits at the entry point of the 27–33 preferred zone.
Cup 2 was disfavored. A ground color of 78.8 placed it in the medium-dark zone and a gradient of only 20.8, the narrowest of the three. At that color level, the dominant flavor compounds are roast-derived rather than origin-derived, and a darker internal structure leaves nowhere for brightness or sweetness to emerge. The jury's note of roastiness is precisely what the framework predicts for a narrow gradient at darker development.
Cup 1 was more instructive for its subtlety. A ground color of 88.4 is within the light-medium range — comparable to the best-scoring roasts we would see in the competition. The surface and interior colors are in the right area. But a gradient of 26.1 sits just below the preferred zone boundary. The jury did not note roastiness; they found the cup imbalanced. That distinction matters. The color was reasonable. The structure — the relationship between surface and interior — was slightly off.
Cup 3 had a ground color of 89.0, nearly identical to Cup 1's 88.4. The difference between a jury favourite and an imbalanced cup is not found in the color reading alone. It is found in 1.6 gradient points.
That calibration exercise established, before a single competition batch was measured, that the jury's palate was already responding to gradient differences in exactly the way the framework predicts. The preferred zone is not an abstraction. It was the zone the jury chose.
The Competition Data
Twelve roasts. The Omix readings, roast variables from GiesenCloud, and final competition scores gave us a dataset small enough to examine individually and large enough to look for patterns.
The full standings ranged from a winning score of 74.36 down to 61.09. Here are the color variables for each placement:
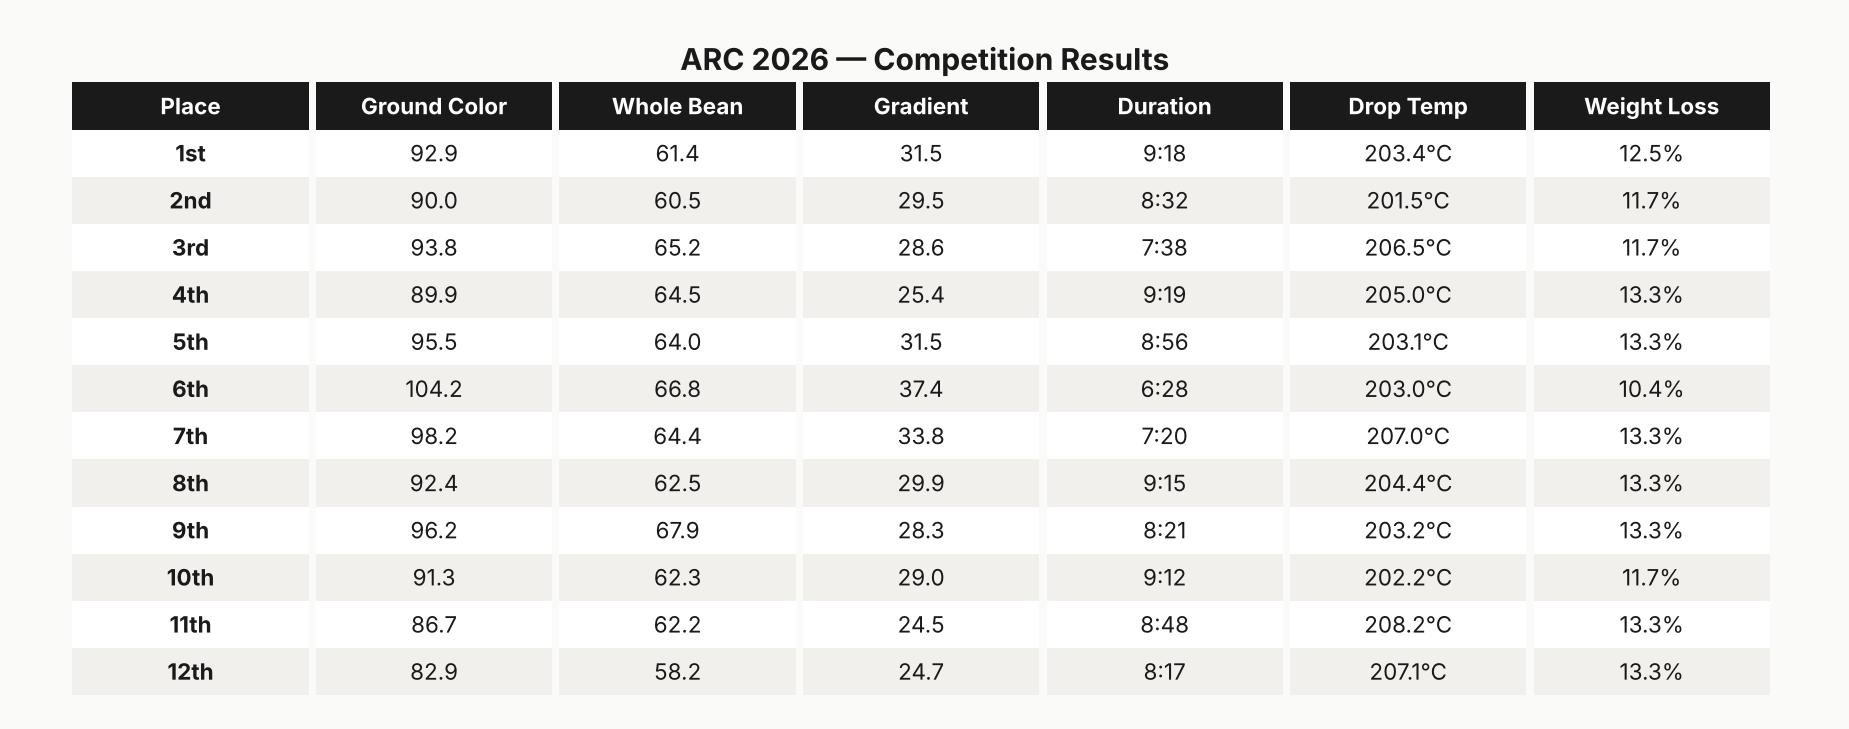
Several patterns emerge immediately.
Ground Color vs. Competition Score
Lighter internal development — meaning the cell structure retained more volatile aromatics and origin-derived acids — was associated with higher scores. The preferred zone for ground color in this dataset was 88–96 CM100 points.
The 1st-place roast registered a ground color of 92.9, comfortably inside the preferred zone. The 12th-place roast registered 82.9 — darker, in the medium-dark territory where roast character begins to dominate. The most notable outlier is 6th place at 104.2, the lightest ground color in the field by a wide margin — underdeveloped on the inside despite placing mid-table, which illustrates that ground color alone does not determine outcome. The 11th and 12th place roasts at 86.7 and 82.9 are the darkest in the field. Underdeveloped and overdeveloped are both failure modes. The data reflects that.
The Gradient: A Closer Signal
The gradient carries information that the color reading alone cannot. It describes not just where the roast landed but how it got there — specifically, whether the interior and exterior of the bean developed in proportion.
The top three finishers recorded gradients of 31.5, 29.5, and 28.6 — all within the 27–33 preferred zone. 4th place at 25.4 sits just below the zone boundary, and 5th place at 31.5 matches 1st exactly. The mean gradient for the top five was 29.3 points.
The widest gradient in the field belongs to 6th place at 37.4 — the roast with the fastest total duration at 6:28. 7th place recorded 33.8, also above the preferred ceiling. At the other extreme, 11th and 12th place recorded the two narrowest gradients: 24.5 and 24.7, both below the zone floor. The zone penalises in both directions.
Compare the 6th-place gradient of 37.4 — fast roast, aggressive heat, exterior developed well ahead of interior — with the 1st-place gradient of 31.5, and the picture is clear: the competition rewarded roasts where the surface and interior developed in measured proportion.
Why Faster Roasts Produce Wider Gradients
The clearest mechanical demonstration in this dataset comes from the relationship between roast duration and gradient — the strongest directional relationship in the entire analysis.
Understanding why requires thinking about heat transfer within the bean. In the early stages of a roast, heat reaches the exterior surface first. The outer layers desiccate, caramelize, and develop color well ahead of the interior. If the roast moves quickly — driven by a high charge temperature or aggressive early energy — the surface develops rapidly before the interior has time to catch up. The gradient widens.
After first crack, the dynamic changes. The cell walls rupture and become more porous, allowing heat to penetrate more efficiently. Given sufficient time in the development phase, the interior color approaches the surface color and the gradient narrows. A slower roast, particularly one with a controlled development phase, allows this convergence to occur. A fast roast cuts it short.
The 6th-place roast was the fastest in the field at 6 minutes and 28 seconds, launched from a charge temperature of 220.2°C. The result was a gradient of 37.4 — the widest recorded. The roast was aggressive, the exterior developed hard, and the interior never had time to close the gap. That the roast still placed 6th suggests other sensory qualities partially compensated, but the structural imbalance was measurable.
The 7th-place roast used the highest charge temperature in the field at 238.9°C over 7:20, producing a gradient of 33.8 — also above the preferred ceiling. High charge temperature drives rapid early surface development regardless of total duration. What matters is not time alone but the relationship between early heat application and the development phase that follows.
The drop temperature picture is less clean than the gradient data but still informative. The top two finishers dropped at 203.4°C and 201.5°C. 3rd place dropped at 206.5°C, outside the tightest cluster, yet still scored well — indicating that drop temperature is one variable among several rather than a single determining factor. The bottom two finishers dropped at 208.2°C and 207.1°C. Finishing hotter tends to push interior development past the point where origin character is preserved, but the relationship is not absolute.
The Emergence of Relative Preferences
The most striking finding in this dataset is not a single correlation. It is what happened independently, across twelve different competitors, within the top five placements.
Each roaster arrived with their own approach, their own equipment settings, their own read on the green coffee. No explicit roast target was published. The jury scored blind, without access to any color measurements. And yet the top five finishers converged on ground colors within a six-point range — 89.9 to 95.5 — and gradients between 28.6 and 31.5.
This convergence was not coordinated. It emerged from the independent decisions of twelve roasters and the independent evaluations of five jury members. The jury preferred certain cups. Those cups, when measured, occupied a specific zone. The roasters who landed in that zone — whether by design or by intuition — were rewarded.
The calibration data from earlier that morning narrows the window further. Cup 3, the jury favourite from the calibration exercise, had a ground color of 89.0 and a gradient of 27.7. The 1st-place competition roast recorded a ground color of 92.9 and a gradient of 31.5. Different roasts, different profiles, different competitors — and yet both results describe the same structural property.
That structural property appears to be a genuine feature of how well-developed coffee presents in the cup, not an artifact of one jury's preference or one day's scoring. When multiple independent actors converge on the same narrow range from different directions, it suggests that the preferred zone is describing something real about the coffee — something sensory, something physical — rather than reflecting an arbitrary standard.
What the Development Time Ratio Did Not Tell Us
One result deserves mention precisely because it was absent. Development Time Ratio — the percentage of total roast time spent in the development phase after first crack — showed essentially no relationship with final score.
DTR is widely cited in specialty coffee as a proxy for roast quality. The assumption is that longer development time relative to total roast time produces better-developed, sweeter cups. This dataset does not support that assumption, at least not at the competition level. Roasts with DTRs across the full range of observed values scored both well and poorly. The ratio alone was not predictive.
This is not a refutation of the concept of development time. It is a narrower point: DTR expressed as a percentage of total roast time does not capture the quality of what happened in that time. A long development phase in a high-charge, short-total-duration roast is structurally different from the same percentage in a slower, lower-charge roast. The absolute variables — actual duration, actual temperatures, actual color outcomes — carried more signal than the ratio.
The gradient integrates these variables. It is the outcome of all the decisions made during the roast: charge temperature, airflow, energy curve, first-crack response, development time. Two roasts with the same DTR can have very different gradients depending on how they were structured. The gradient is what the jury tasted.
A Note on Scale
Twelve data points is a small sample. The correlations reported here are patterns worth investigating. The preferred zone of 27–33 gradient points is a working hypothesis, supported by this dataset and by the calibration exercise, but it requires testing across different origins, different roaster types, and different jury compositions before it can be treated as a reliable standard.
What this dataset provides is a proof of concept. The jury's sensory preferences, expressed independently through blind scoring, aligned with measurable color structure. The calibration exercise, conducted before any competition scoring, independently validated the same zone. Two datasets, one morning, converging on the same conclusion.
That convergence is worth documenting carefully — which is what this article is.
Following the competition, all twelve competitors received their full placement results alongside the roast color data for every batch. The intent is that this information is genuinely useful: knowing where your roast sat in the gradient range, and how that compared to the roasts that placed above and below you, gives each competitor a concrete starting point for understanding the outcome. Measurement without feedback is incomplete. The data was shared so that it could be used.
