Weight Loss & Moisture Content
Every roaster records weight loss. It is one of the most consistently tracked metrics in the roastery — noted at the end of every batch, compared across profiles, and used as a shorthand for roast degree. A roaster targeting 13% weight loss has a clear intention. The problem is that 13% means something different depending on where the coffee started. Weight loss, as it is commonly used, is an absolute number applied to a relative situation. This article proposes a more precise way of reading it.
What weight loss actually measures
When green coffee is roasted, it loses mass. The majority of that mass is water. As the roast progresses beyond the early drying phase, CO₂ and other volatile organic compounds begin to contribute to the loss — but water accounts for the dominant share. The final weight loss percentage is therefore a function of two things: how much water the coffee contained before roasting began, and how far the roasting process drove development beyond the point of full moisture evaporation.
This is the distinction that most roasting protocols overlook. Weight loss is treated as a proxy for roast degree when it is more accurately understood as the combined result of moisture evaporation and roast development. Separating these two components is the first step toward using weight loss as a precise QC metric rather than a rough indicator.
The moisture variable
Green coffee arrives at the roastery with a moisture content that varies by origin, processing method, and storage conditions. Typically, green coffee falls between 9% and 12% moisture, with most lots sitting in the 10–11.5% range.
A washed Ethiopian and a natural Brazilian may both be described as medium roast targets, but if the Ethiopian arrives at 10% moisture and the Brazilian at 11.5%, applying the same weight loss target to both is a structural error. If both coffees are roasted to 13% weight loss, the Ethiopian — having started drier — has undergone proportionally more development beyond the drying phase than the Brazilian. They have not been roasted to the same degree. They have been roasted to the same number.
Reading weight loss as a relative metric
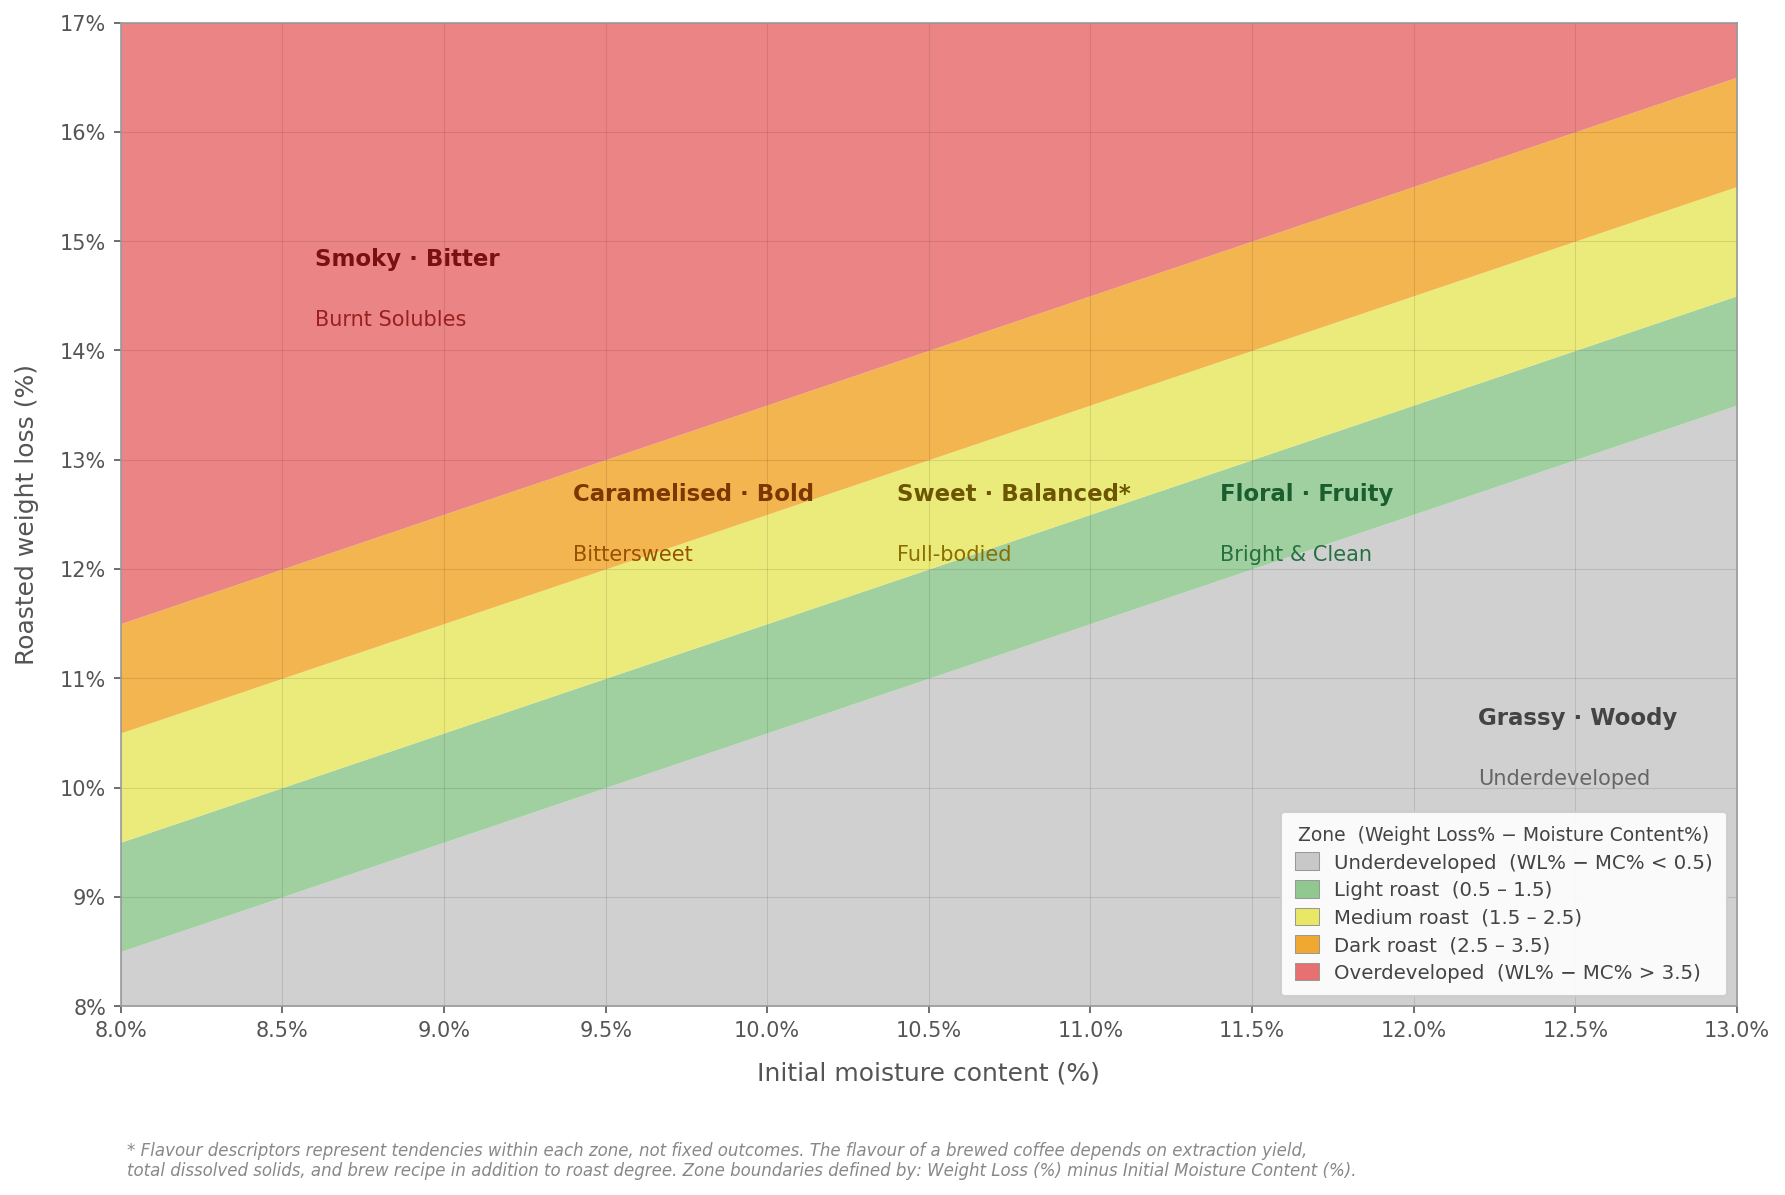
The chart below maps roast development zones across a range of initial moisture contents and weight loss outcomes. The diagonal banding is the key insight: the boundaries between underdeveloped, light, medium, dark, and overdeveloped roasting are not horizontal lines. They slope. A coffee at 11.5% moisture needs to reach a higher absolute weight loss to achieve the same roast degree as a drier coffee. The zones travel with the moisture content.
This has an immediate practical implication. A roastery operating with a fixed weight loss target — say, 13.5% for all medium roast profiles — will systematically over-develop drier coffees and under-develop wetter ones when assessed against actual roast degree. The number is consistent. The outcome is not.
What this means for roast profiling
The logical response is to adjust weight loss targets based on incoming moisture content. A coffee arriving at 10% moisture might target 12–13% weight loss for a medium roast outcome, while a coffee arriving at 11.5% moisture targets 13.5–14.5% for the equivalent result. The specific numbers will vary by roaster, machine, and batch size — but the principle is consistent: weight loss targets should be calibrated to the starting point, not applied uniformly across a variable green inventory.
This does not require new equipment or new software. It requires moisture measurement at intake — which most roasteries already perform — and a simple adjustment to how weight loss targets are recorded and applied per lot. The roaster who tracks both incoming moisture and outgoing weight loss has the data to build a moisture-adjusted development index. Those who track only weight loss are working with half the picture.
The flavour consequence
Roast development has a direct relationship with which solubles are made available for extraction. An underdeveloped coffee — one that has not reached sufficient internal temperature to fully break down cell structure and develop sugars — will produce grassy, woody, or astringent notes regardless of how carefully it is brewed. An overdeveloped coffee will produce smoky, bitter, or hollow flavours as good soluble material degrades and cell structure becomes fragile.
The medium roast window — where sweetness, balance, and body are most accessible — is not a fixed weight loss number. It is a zone that moves with moisture content. A roaster who understands this is not simply hitting a target. They are making a calibrated decision about development relative to the specific coffee in the drum. This distinction matters beyond the roastery. A roastery supplying wholesale clients with QC parameters expressed only as weight loss percentages is communicating an incomplete specification. If the green inventory changes — a new crop, a different processing lot, a supplier switch — the same weight loss target may no longer produce the same cup. Pairing moisture content with weight loss in client-facing specifications closes that gap and gives wholesale relationships a more stable technical foundation.
A starting framework
For roasters who want to begin working with moisture-adjusted targets, the following approach is a practical starting point. Measure green moisture at intake and record it against the lot. Roast to your existing target and record weight loss as normal. After cupping, note whether the roast degree aligns with your intention — and if not, note the direction of the discrepancy. Over several lots across a moisture range, a pattern will emerge that allows you to build a simple adjustment table specific to your machine and batch size.
This is not a formula that removes the craft from roasting. It is a framework that makes craft repeatable. The roaster who understands where their coffee started is better equipped to decide where it should finish.
Weight loss, moisture, and color — a complete picture
Weight loss, even when adjusted for moisture content, remains an indirect measure of roast degree. It tracks mass change as a proxy for energy input — useful, but one step removed from the transformation happening inside the bean. Color measurement — whole bean and ground, using a colorimeter — provides a direct reading of that transformation and is the more precise metric for QC purposes.
Used together, moisture-adjusted weight loss and color measurement describe the roast from two complementary angles. Weight loss tells you how much mass the coffee surrendered during roasting. Color tells you what the bean actually became. Neither is sufficient on its own. A roaster tracking all three variables — incoming moisture, outgoing weight loss, and roast color — has a complete picture of what happened between green and roasted, and a reliable foundation for designing extraction targets that produce consistent results in the cup.
